WAMU’s Tom Sherwood just reported on X that D.C. State Superintendent of Education Dr. Christina Grant is leaving her post to become the executive director of the Center for Education Policy Research at Harvard University. According to today’s news release from CEPR, Ms. Grant has been at OSSE since 2021.
The announcement is fitting and completely in sync with Mayor Muriel Bowser’s schizophrenic view of the District of Columbia. Allow me to explain.
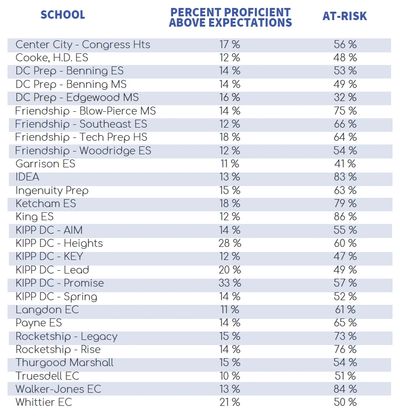
Last Friday I attended the D.C. Policy Center’s conference regarding the release of their study entitled “State of D.C. Schools, 2022-23: Challenges to pandemic recovery in a new normal.” The entire meeting came across as bizarre to me. All in attendance, including educators, local education leaders, and policy people, were in a tremendously good mood. It seemed that everyone was congratulating themselves and each other on the tremendous job being done to teach young people in our city. The opening remarks were provided by Ms. Grant and she stayed throughout the hour-long conference. I had not had the opportunity to observe the State Superintendent in action. I have to say I was impressed. Her words were highly enthusiastic and she remained that way upon returning to her seat. Sitting a few rows behind her I saw the Superintendent shaking her head affirmatively to all that she heard, while often using hand motions or clicking her fingers to show her complete support for the comments of panalists. At various points I thought she might just fly above the room. When I came home I actually commented to my wife that I could not imagine someone over this government agency being so animated as much of what OSSE does revolves around data collection and grant compliance.
There was absolutely no hint by Ms. Grant or others that she had accepted a new position. There was also little regard for the 2021 to 2022 PARCC standardized test results that demonstrated 31 percent of students in D.C. are proficient in English Language Arts, while 19 percent of students are proficient in math. My mood soured as the disconnect between the dismal state of academic achievement in the nation’s capital and the euphoria of the audience looked like a scene depicted in a surrealistic painting.
I have had time recently to watch online Mayor Bowser at various events around town. Her optimistic outlook seems an insult to what many are experiencing recently in the District. Allow me to give you an example. On my way to the Martin Luther King Library to join the Policy Center event, I arrived at 9 a.m., a half hour before the library opened. It allowed me to witness all the people sleeping in front of the structure . As I walked around the block looking for someplace to eat breakfast I saw building after building of vacant storefronts. The smell of marijuana filled the air. The streets were almost completely void of pedestrians. Considering all the crime that has been taking place in the city I was afraid to be there. The only way to describe the scene in comparison to before the Covid pandemic is night and day.
It is probably best that Dr. Grant is moving to Cambridge. I wonder how much longer she could have kept up the ruse.


You must be logged in to post a comment.